Transforming a Global Retailer’s Network Visibility
Interlink Software Consultant Matthew Sweeney talks through how one of our global retail customers gained total visibility of network device performance statistics and metrics.
The context
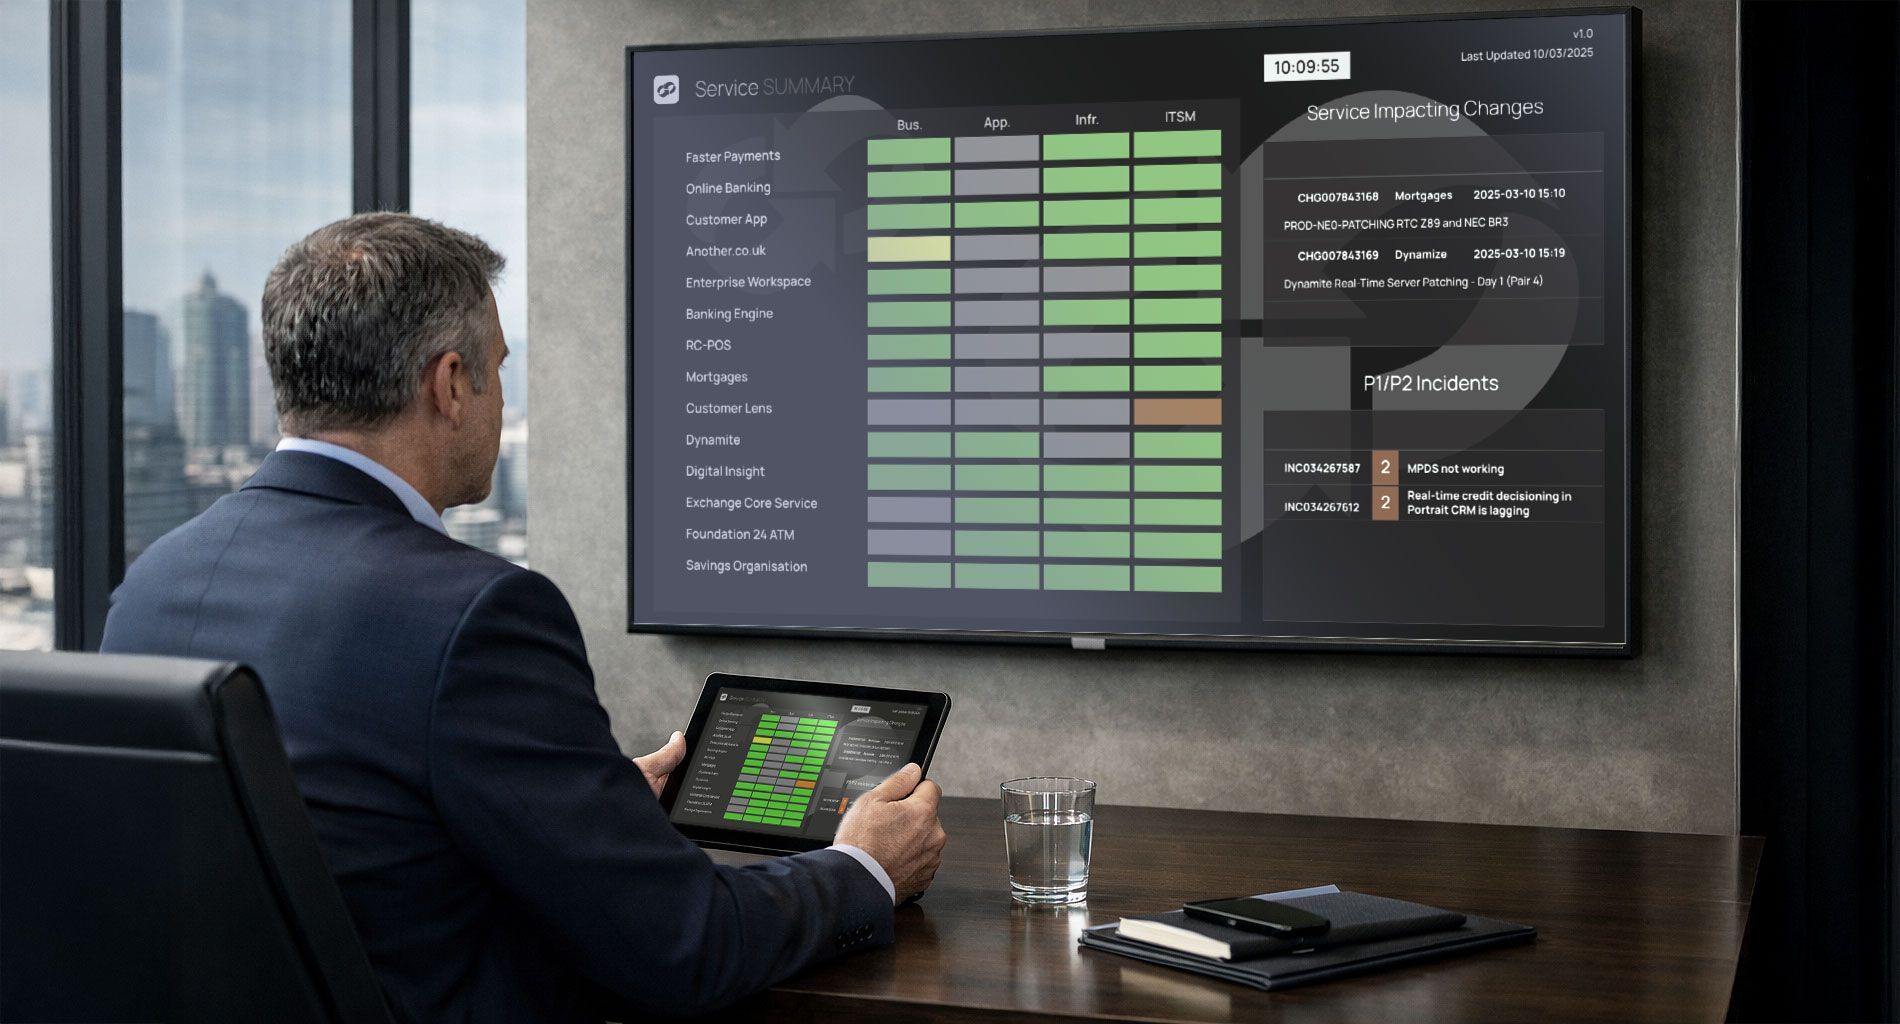
They’re a household name in the retail world. 150,000 staff service millions of customers instore and online every year. They have a whopping 30,000 IT services under management, running across a global network that spans hundreds of sites. Interlink Software already provide real-time monitoring dashboards that help IT Operations staff to visualize service availability, giving them early warning of potential outages that might hit their mission-critical applications and impact on customers.
The problem
The customer has never been able to visualize the health of their network as a whole. To date, they’ve only had access to very patchy statistics and metrics. Customers can’t effectively manage what they can’t see.
Building total network visibility
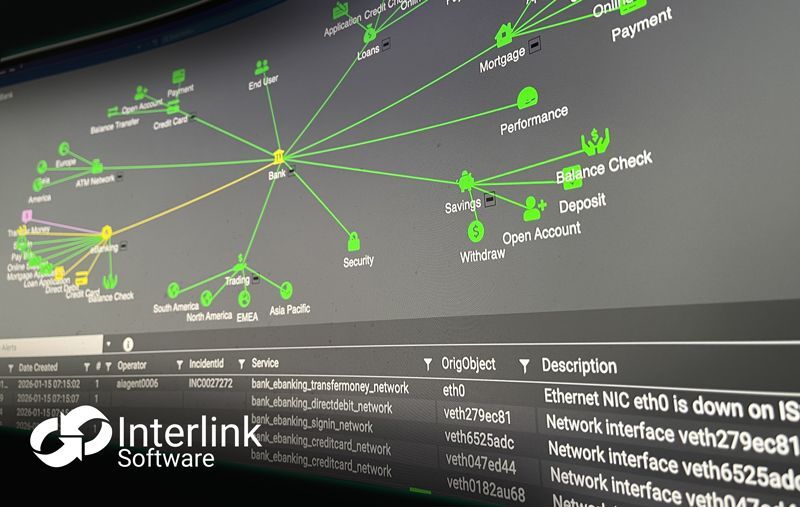
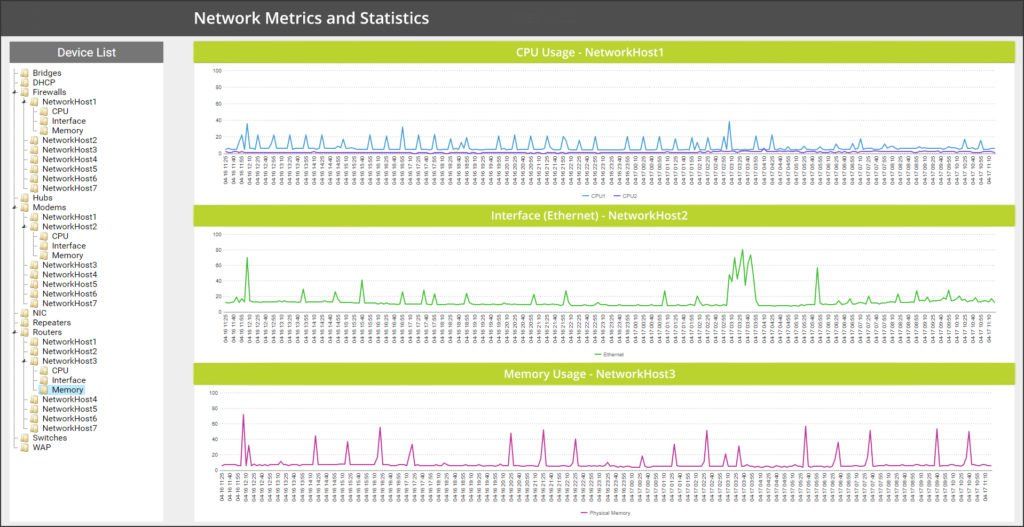
We started off by gathering monitoring and performance data from everything on the clients’ network. This included routers, switches, firewalls, modems, network bridges, CPU interfaces, as well as bringing in aspects like CPU usage and memory consumption etc. We pulled data in from devices by connecting to SNMP agents and started listening for HTTP events on ports for example. The monitoring configuration set up was automated to update itself dynamically as devices are introduced or removed from the network. We designed a Network Metrics and Statistics Visualization Dashboard
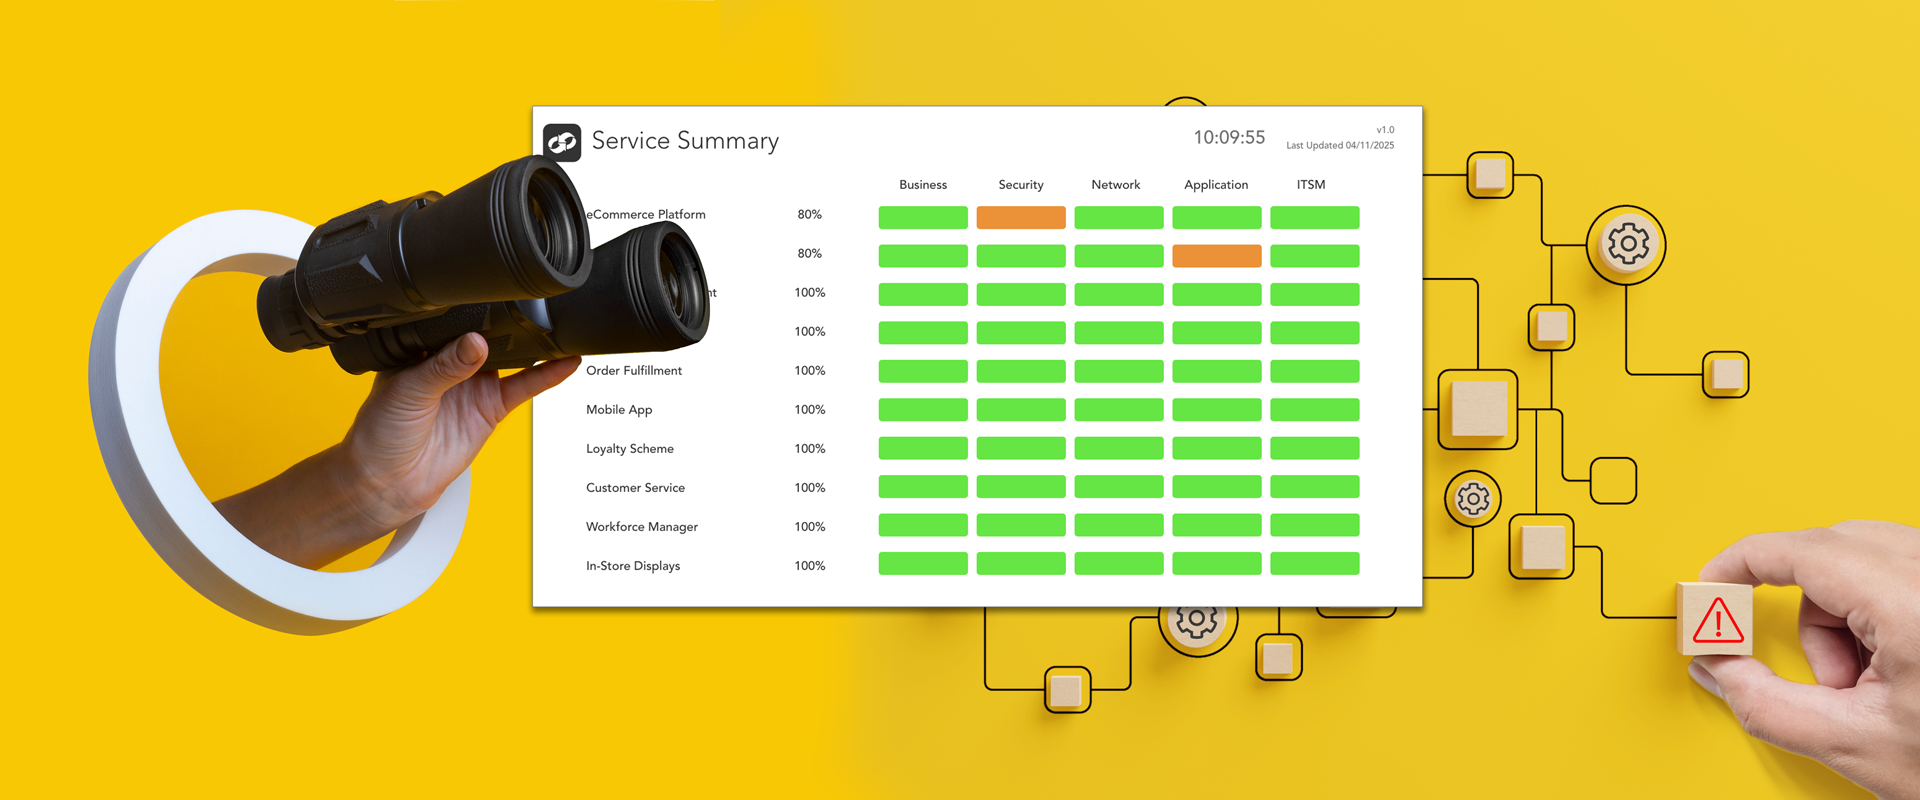
to package up and present the data back to IT staff clearly – in a Single-pane-of-glass
Network Metrics and Statistics Dashboard
The metrics gathered are given a timestamp. These are stored in a time series database. This way the client has the ability to view, filter, compare and analyse metrics from any network device, over any given time period. They can monitor network changes that might pose a risk to service, look out for increased or decreased device performance, correlate network issues with logged incidents and service outages.
What’s the future got in store?
As a by-product of the introduction of this Single-pane-of-glass
for the network, a valuable historical baseline of network performance has been established. They can identify trends, spikes and deviations from the norm that will be helpful in avoiding anything that might pose a risk to business as usual. These insights can gradually be used in a predictive/proactive manner to protect service availability and keep their customers happy.
Problems Visualizing Network Statistics and Metrics? – get in touch HERE
About Matthew
Matthew joined us 7 years ago, working his way up from Technical Analyst to his current role as Consultant helping lead software deployments across our customer base.