Blog Post

Back to the Future with Single-Pane-of-Glass

Website Editor • Jun 14, 2018
Back to the Future with Single Pane of Glass

Grant Glading, Head of Sales and Marketing at Interlink Software talks about lessons to be taken from IT monitoring history and Single-Pane-of-Glass views …

As the saying goes ‘Those who do not learn history are doomed to repeat it’

I’ve been working for large organizations for a long time. Since the early 90s in fact. That’s the 1990s not the 1890s – cheeky!

In the 90s I saw the move from mainframe-centric computing to open systems and client/server computing. Along with this came the rapid accumulation of domain-specific monitoring and administration tools.

It’s information overload for the IT staff trying to monitor these tools individually. Joining the dots, understanding the health and well-being of the business services underpinned by the myriad interfaces and overlapping outputs.

This time around …

The tools du jour are the DevOps staples of Jenkins, Docker, Ansible, Nagios, Jira, Maven, etc., etc. I could go on ad nauseam. And yet, well into the 21st century, I’m seeing the very same patterns of behaviour emerge in large corporates as I witnessed back then.

There is no single, overarching view, consolidating all of the monitoring tools and discerning what they’re trying to tell us in all their glorious red, amber, green, RAG status widgets and dials.

Sure, REST-based web services APIs often help simplify integration. But the real imperative is to identify what all these events, metrics and exceptions mean in business terms?

This time you can be ready!

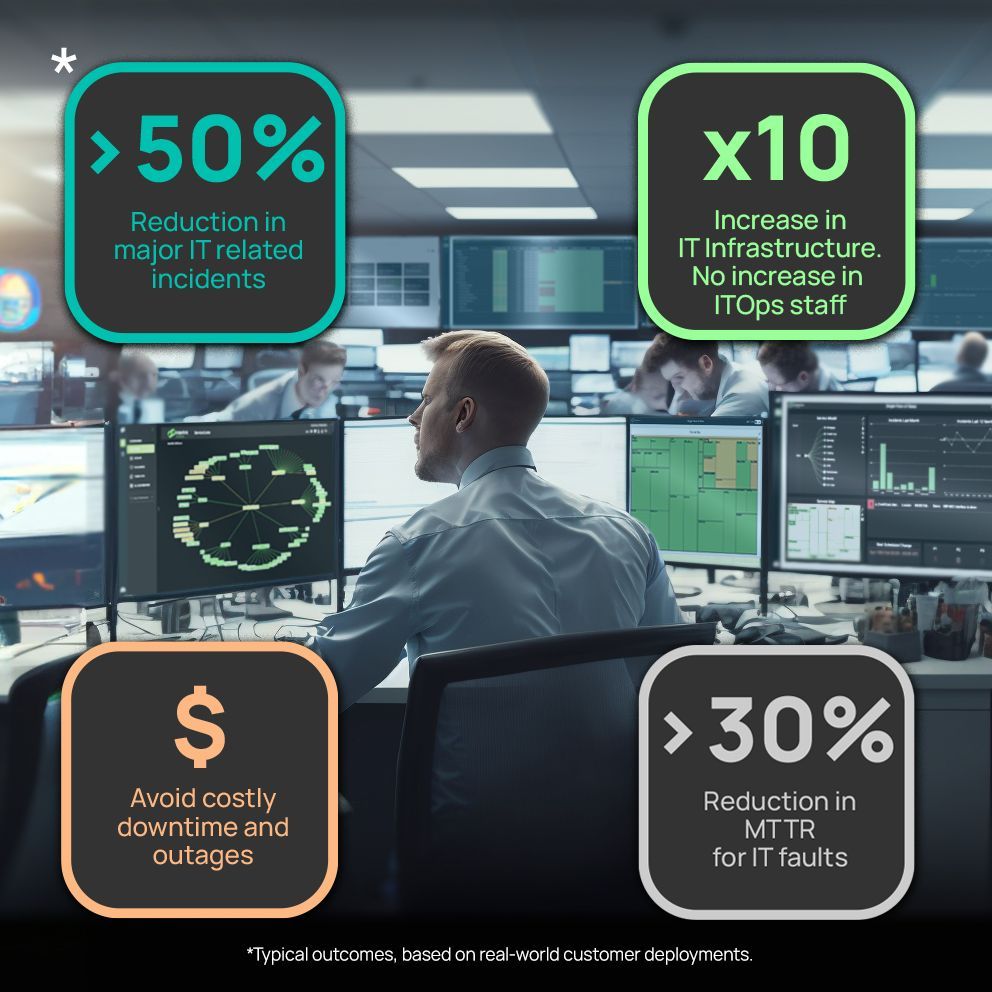
Luckily, organisations like the one I’m part of have been working with forward-thinking clients from a variety of industries and are taking steps to avoid history repeating itself!

Last generation manager of managers (MoM) tools ingested events from a patchwork of tools and consoles adding some cursory de-duplication and prioritisation before painting a ‘sea of red’ alerts on their console.

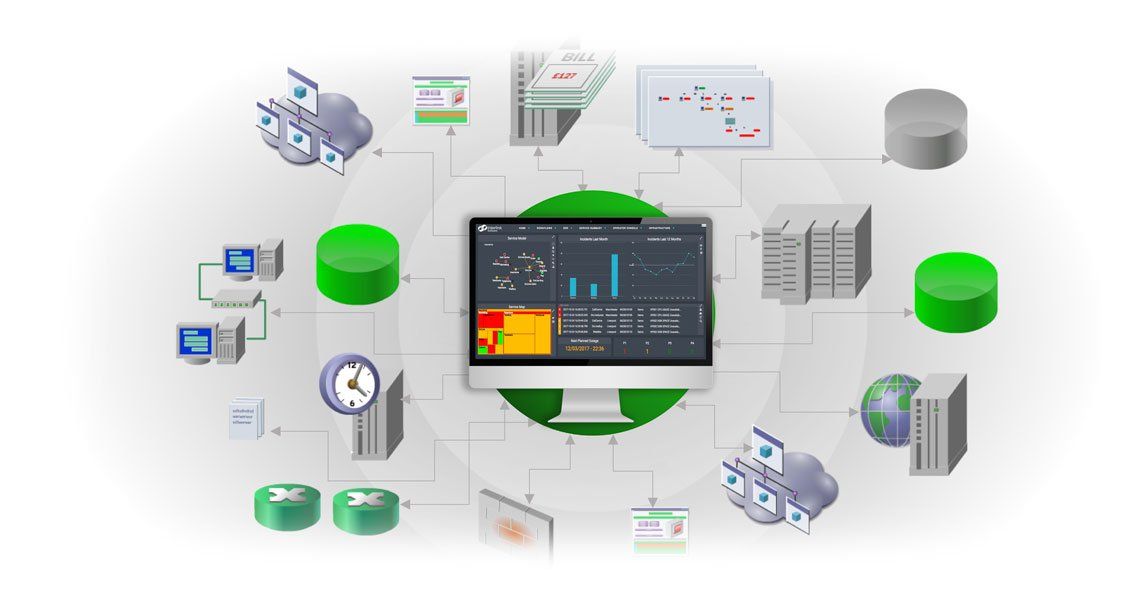
The latest AIOps tooling from Interlink Software is unique in that it integrates with the underlying tools all the way from the data center to the cloud at three different, but equally important levels:

1) Event and metric level (from your own monitoring tools)

2) Configuration level (the linkages or dependencies between objects in your environment)

3) User interface level (the underlying web interfaces of your existing monitoring tools and apps)

Making real the historically elusive Single-Pane-of-Glass the benefit of this 3-level approach is that you can achieve delivery of consolidated monitoring events and metrics – in context, both in business and technical terms. And when only deep-dive to the native GUIs will do for triage – seamlessly drill down from SPoG view to your underlying tooling.

Grant Glading has approaching 30 years’ experience in systems management gained at Bank of America, MAXM Systems, Boole & Babbage and BMC Software. Grant leads direct sales, channel partners and marketing efforts for Interlink Software, having successfully sold into and account managed numerous Global 500 customers.

GET IN TOUCH HERE TO REQUEST A DEMO

How Do You Monitor Dynamic Amazon Web Services (AWS) Cloud Architectures?
By david.arrowsmith 15 Feb, 2024
Comprehensive visibility across all your Amazon Web Services (AWS) environments plays an important part in maintaining the availability, and performance of applications hosted in AWS. Leveraging Interlink Software’s AIOps and Business Service Observability Platform , enterprises can greatly enhance their capability to monitor, manage and optimize the health of applications and act swiftly resolving issues before they impact on customer experience. The Interlink platform ingests event data from Amazon CloudWatch and monitors events from various AWS cloud products via Amazon SQS - providing IT teams with unified visibility into the health of AWS-hosted applications, enabling proactive detection of issues based on customer or region. Interlink combines AWS event data with operational information from other sources, including CMDBs, service desk, monitoring, and APM tools. Through event correlation, normalization, thresholding, and business logic, the platform reveals IT dependencies and the cascading business impact of failures across different areas for true 360-degree visibility of service health. To facilitate more efficient and streamlined application troubleshooting and incident resolution, users can take advantage of deep links to AWS tooling within the Interlink platform and drill down to source event data and seamlessly initiate automated recovery actions or employ third-party tools – in a single, unified platform. Elevate your capability to monitor applications hosted in AWS. Click here
SCM provides dynamic, real-time, visual representations of every stage of an e
By David Arrowsmith 30 Oct, 2023
Operational resilience is an increasing area of focus and scrutiny for regulators of the banking and financial services industry. In the European Union, the Digital Operational Resilience Act (DORA) looms on the near horizon - with equivalent regulatory frameworks slowly but surely rolling out across the globe. As a result, banking and finance organizations must act to strengthen their ability to absorb operational risk-related events and put measures in place to prevent technology failures which have the potential to cause disruption to financial markets and customers alike. You can’t mitigate and manage risks you can’t see... Your enterprise’s services are composed of thousands of dynamically changing objects, with interlinked dependencies. Understanding the potential risks to operational resilience in highly complex IT environments hinges on being able to visualize how these components work together to deliver specific customer outcomes. Service Chain Mapping: Bring key customer journeys to life, deliver a data-driven audit and compliance solution Eliminating difficult to maintain spreadsheets and static diagrams, Interlink’s Service Chain Mapping solution provides dynamic, visual representations of every stage of an engagement a customer has with your critical business services. Key Benefits: Deliver audit tracking/reporting: Demonstrate your capability to continuously monitor and resolve potential operational vulnerabilities Import data from a variety of data sources and diagramming tools to map out service components and customer touchpoints; put SCM to work with data ingested from monitored objects across your full IT stack Visualize, monitor and triage customer journeys as they flow across interconnected systems and technologies: in a single view, in real-time Drill down to customer impacting incidents and events: pinpoint bottlenecks in process flows, flawed or failed processes and systems Learn more about Service Chain Mapping - Step through the features HERE
Achieving AIOps & Observability for Banking & Finance Organizations
By david.arrowsmith 22 Mar, 2023
Maintaining trust in the business services your customers rely on is everything. With ever-increasing customer expectations and the promise of ‘always-on’ services, poor digital experiences and outages can cause significant harm to your business. The Interlink Software AIOps and Observability platform strengthens IT teams’ capability to deliver more reliable, available digital services and reduce the risk of customer impacting disruption. Monitor and manage complex and highly interdependent hybrid IT infrastructures, provide real-time visibility into the performance and availability of your systems - enabling proactive issue detection and resolution. Visualize service health across the entire IT stack Manage complex IT environments from microservices to mainframes Deliver Hyper Automation for ITOps Analyze and manage the service impact of IT changes - reduce the risk of change
Interlink Software is ready for business on VMware Marketplace.
By david.arrowsmith 14 Feb, 2023
Interlink Software joins a thriving Marketplace, a comprehensive catalog of solutions across sixteen distinct solution categories – with over 2000 products for you to explore, buy and deploy.
Interlink Software arrives on the Cisco AppDynamics Marketplace!
By David Arrowsmith 17 Jan, 2023
We are delighted to share the news that our integration with leading, real-time Application Performance Monitoring (APM) vendor Cisco AppDynamics is now listed on the AppDynamics Marketplace.
Wishing you all a Happy Festive Season and a successful 2023!
By David Arrowsmith 12 Dec, 2022
As the end of 2022 fast approaches, we would like to say a BIG thank you to all of our valued customers and business associates the world over for placing your trust in us to support you on your AIOps and Observability journey. We look forward to working with you in the year ahead, our pledge remains; to continuously listen, work in partnership with you and be inspired to develop great solutions, in step with your ever-evolving needs.
Interlink Software Achieves Cyber Essentials Certification
By David Arrowsmith 01 Nov, 2022
Interlink Software has achieved Cyber Essentials certification, putting us in an even stronger position to stay ahead of cyber threats and support our customers.
Interlink recognized as Representative Vendor in the 2022 Gartner® Market Guide for AIOps Platforms
By David Arrowsmith 07 Jun, 2022
For the second year running, Interlink Software are delighted to have been recognized as a Representative Vendor in the 2022 Gartner® Market Guide for AIOps Platforms by Analysts Pankaj Prasad, Padraig Byrne, Gregg Siegfried, 30 May 2022.
Interlink Software: Enterprise AIOps Platform Mobile App
By David Arrowsmith 29 Apr, 2022
The power of Enterprise AIOps at your fingertips with Interlink Software's App. - Learn more.
Interlink Software arrives on VMware Marketplace
By David Arrowsmith 31 Mar, 2022
Interlink’s AIOps Enterprise Platform joins VMware Marketplace: leverage your VMware vRealize Operations (vROps), VMware vCenter Server deployments.
Show More
Share by: