Service Visualization in a Multisourced IT Environment
Grant Glading, Head of Sales and Marketing with more observations from working with IT Operations command centres across the world …
The days of mega-outsourcing deals of the 90s and 2000s appear to be over. Instead, enterprises are bringing in multiple best of breed vendors to optimise their processes, remove management costs and overheads.
In this new era of multisourcing, Service Integration and Management (SIAM) is becoming a widely adopted approach to managing and controlling multiple service providers.
Good practice and tooling around SIAM are critical to monitoring and maintaining service levels and delivering the benefits.
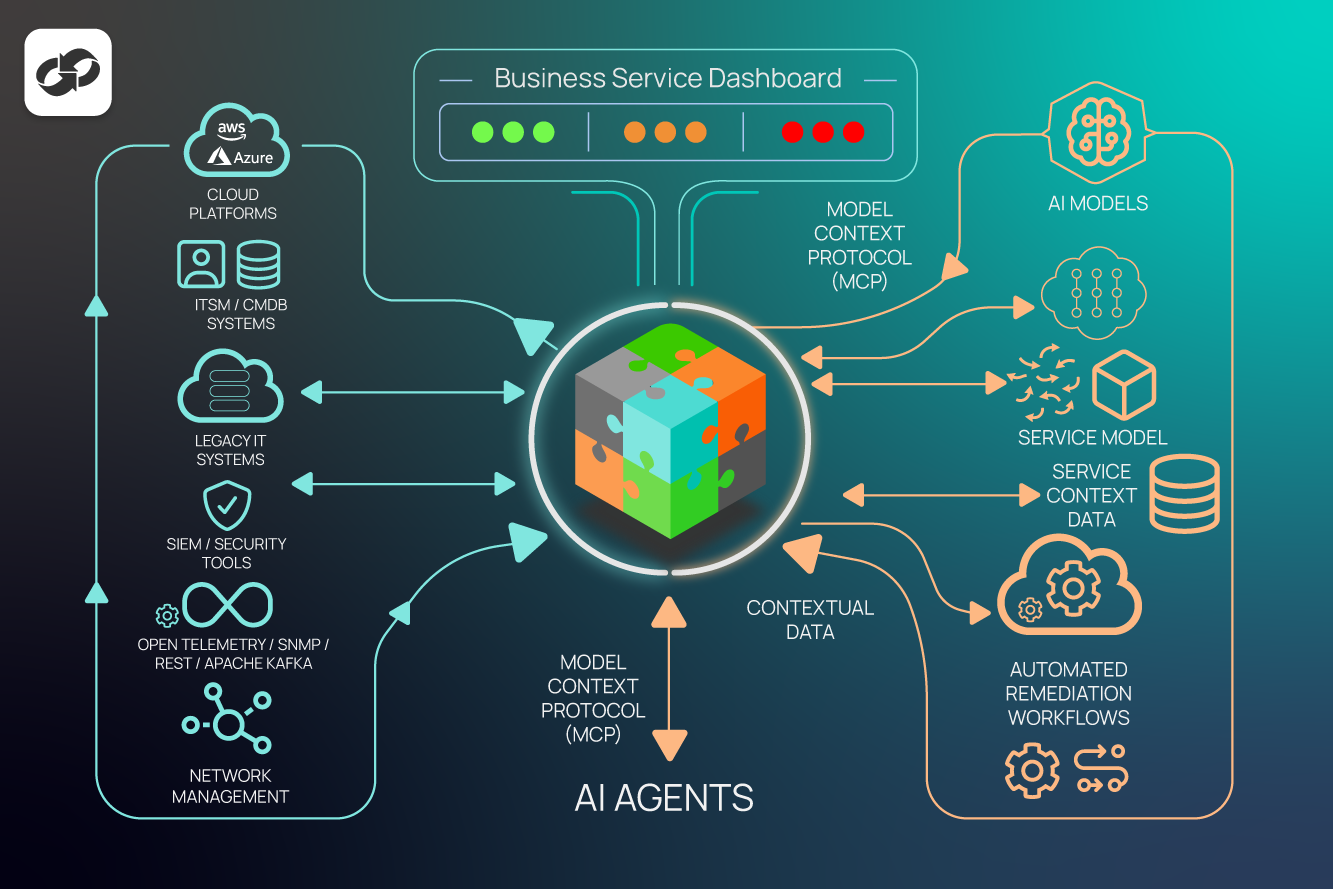
Disparate toolsets and technologies in multi-vendor environments (in addition to those already running within the client site) introduces a new level of complexity into the equation.
For the customer, losing sight of service availability/performance and preventing everything from spinning out of control is a risk.
Ensuring alignment between all parties can be a difficult nut to crack.
Achieving Supplier Performance Transparency and Sourcing Agility in a VDI Environment
Nothing new here, many enterprises run a Virtual Desktop Infrastructure (VDI) – in which their desktop operating systems run and are managed as a remote service.
In the following example, VDI is co-delivered by a number of service providers and the customer itself. Each party has its own toolsets for event/performance monitoring and managing incidents and change.
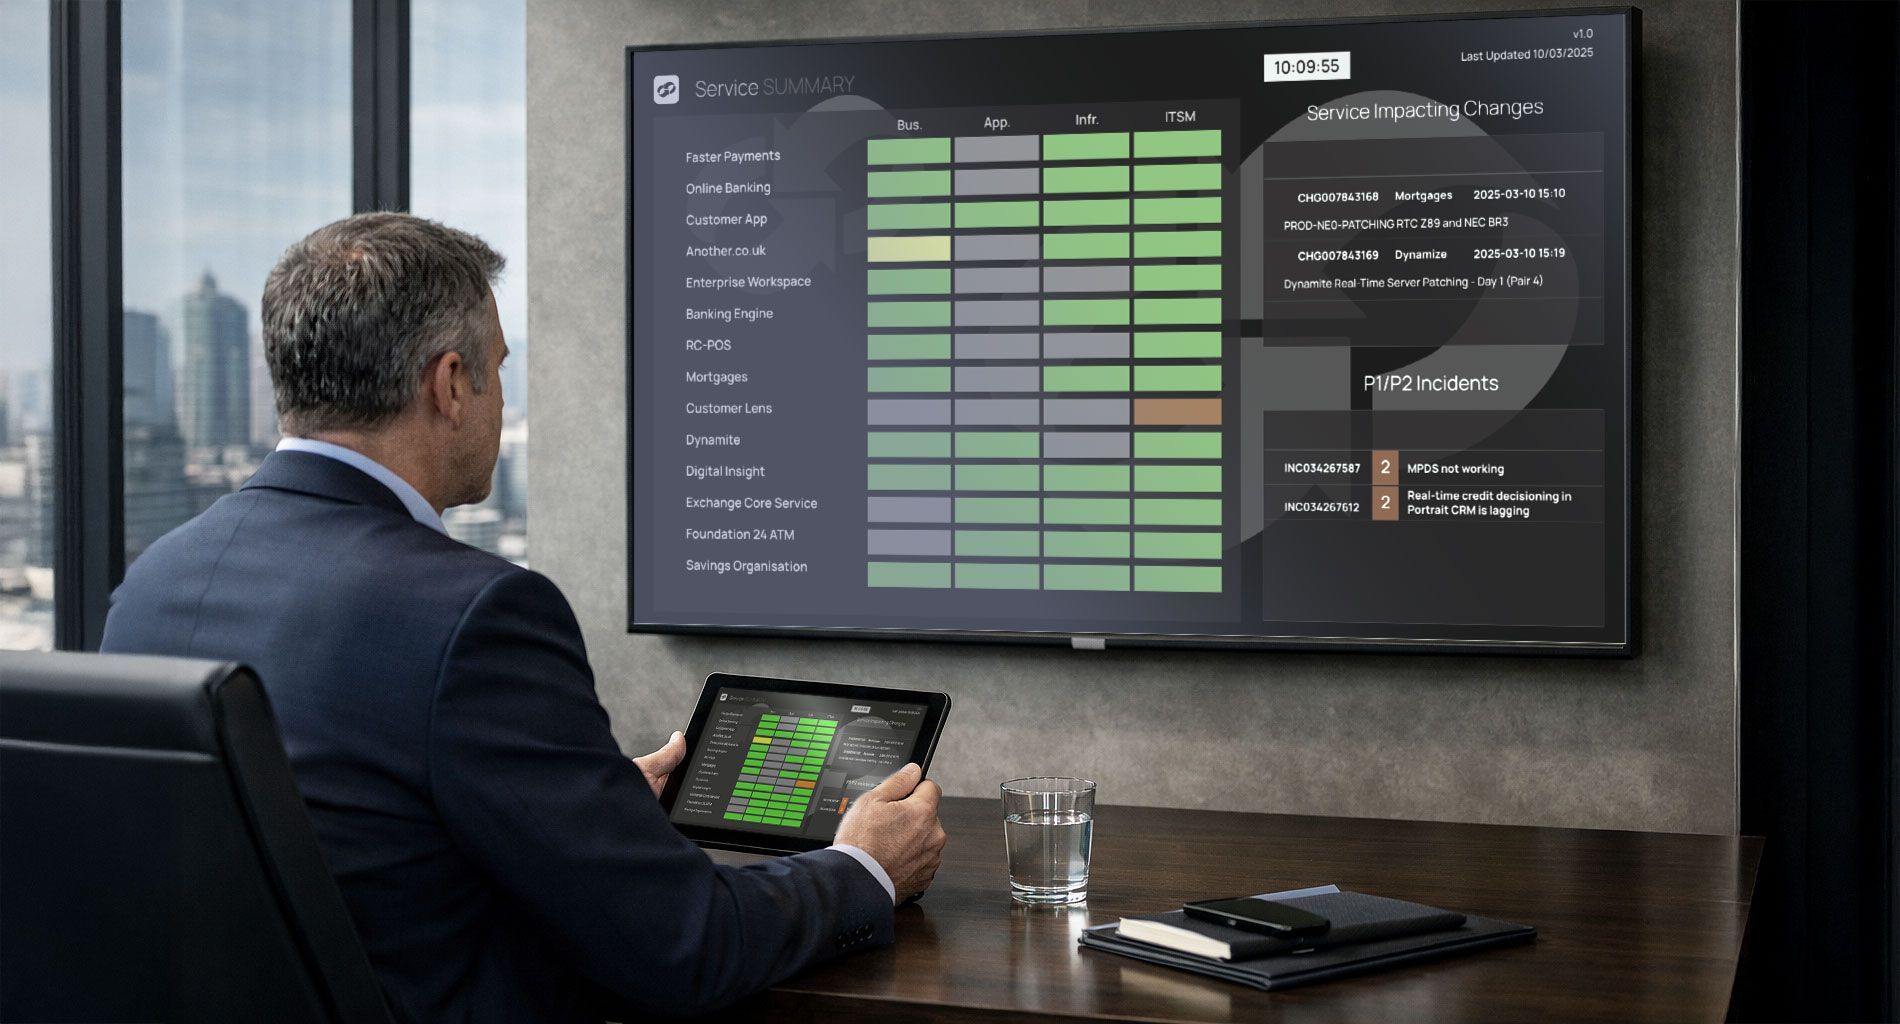
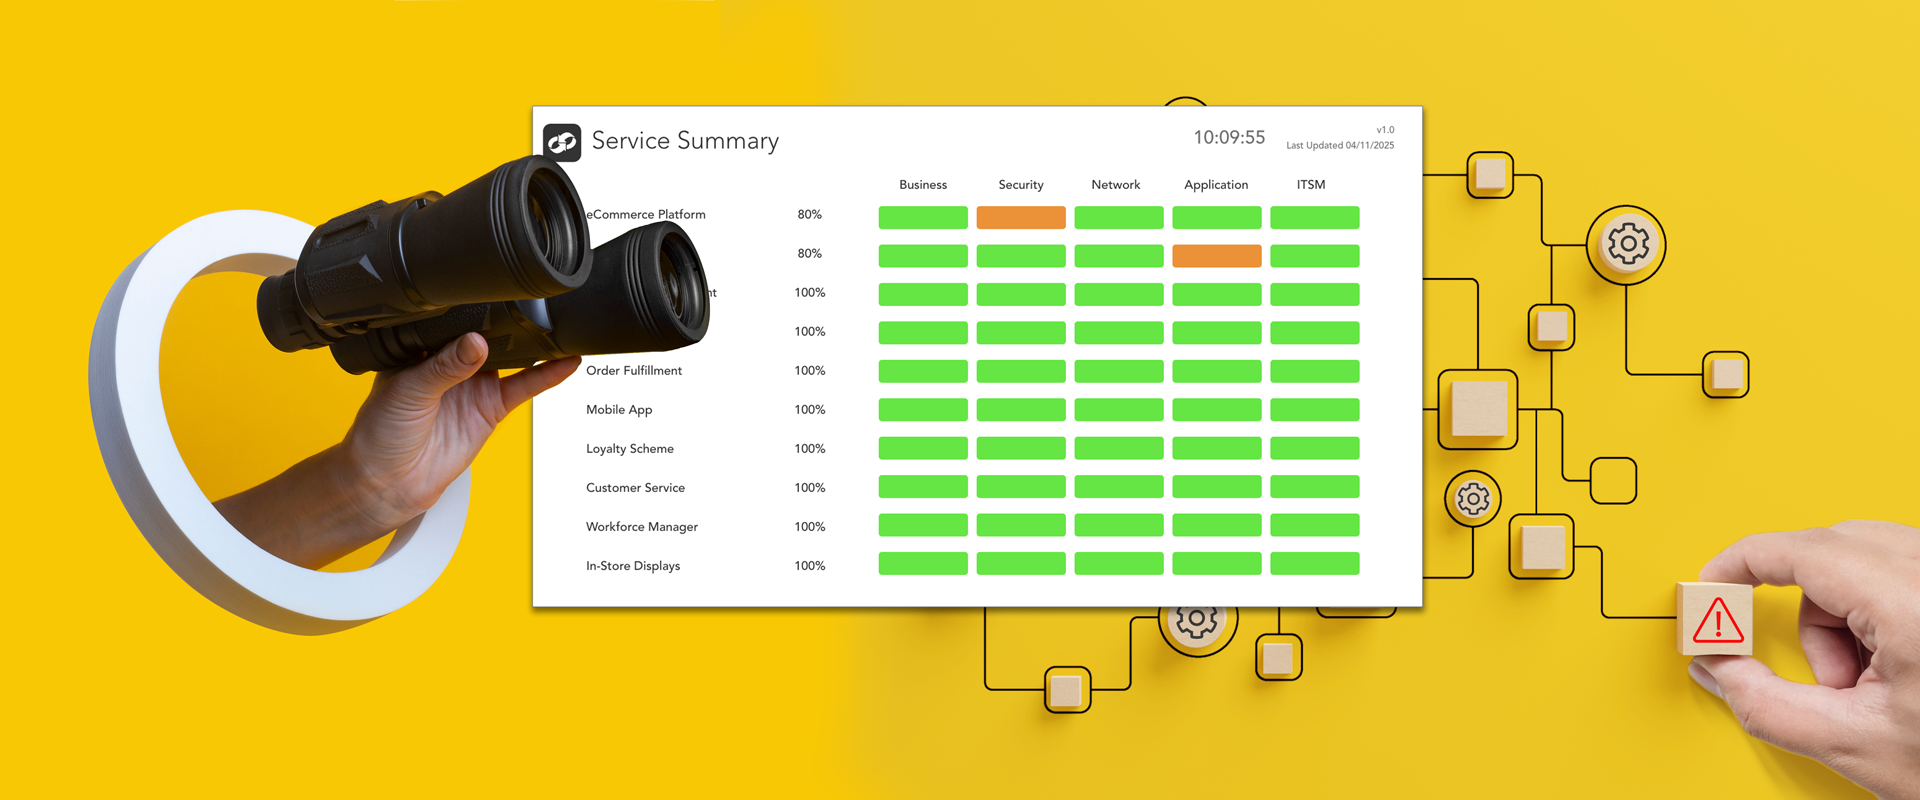
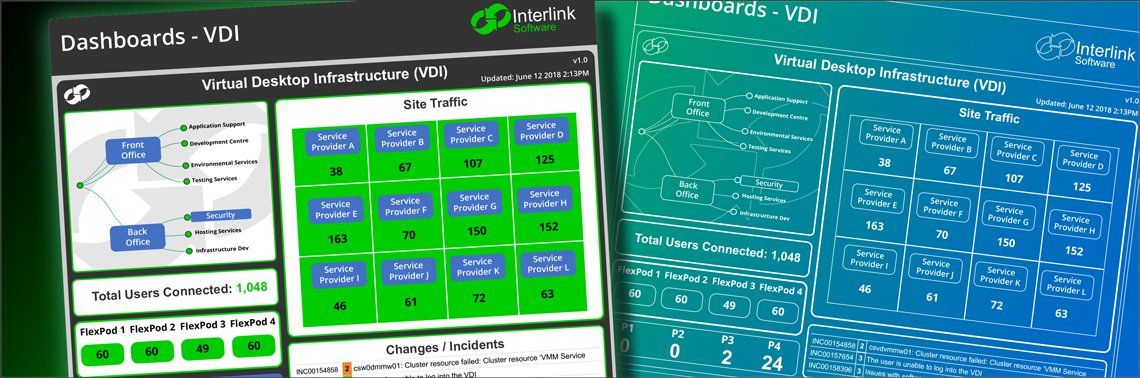
Our job was to establish integrations to feed data into a service visualization dashboard giving the customer a Single- Pane-of-Glass view of site traffic and service availability for the different groups of users tapping into VDI.

The dashboard aggregates and displays various important metrics and information:
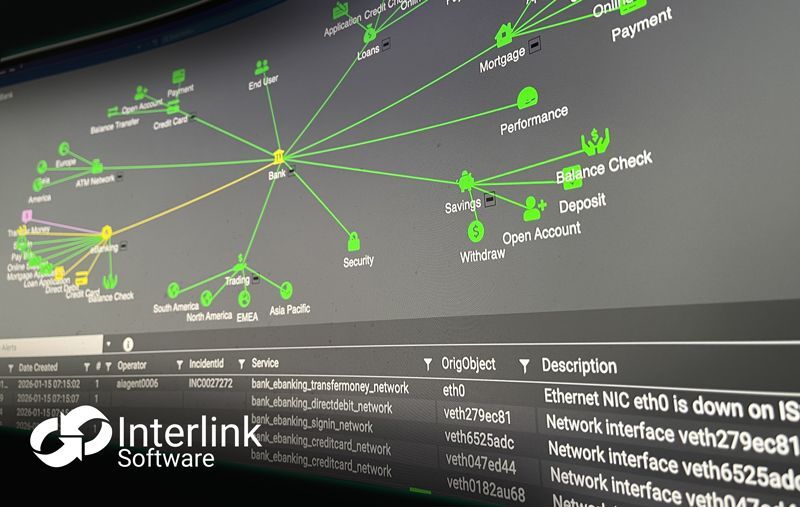
1) Topology of the Service: Maps out the different areas underpinning the VDI service
2) Site Traffic: Numbers of VDI users supported by each 3rd party supplier
3) Additional metrics – the total number of users connected via VDI
4) FlexPod Monitoring: Cisco/NetApp’s data centre computing, networking, and storage integration platform may be another critical component of the service – this shows availability and corresponding volumetric data
5) VDI service impacting incident and change information – achieved through ITSM / service desk tool integration
Talk to us about how service visualisation dashboards could help you drive a successful multisourcing strategy – contact us HERE:
Grant has approaching 30 years’ experience in systems management gained at Bank of America, MAXM Systems, Boole & Babbage, BMC Software, and Interlink Software. Grant leads direct sales, channel partners and marketing efforts for Interlink Software, having successfully sold into and account managed numerous Global 500 customers.